


MACD Indicator Trading Strategy - Secrets Revealed for High Returns


January 22, 2023
5 min
Did you know that MACD is one of the most popular and broadly used indicators by traders? Also, did you know that most of the new traders are using MACD wrong?
Stay with me till the end of this post where I will share with you a little-known strategy using MACD indicators and how you can profit from them.
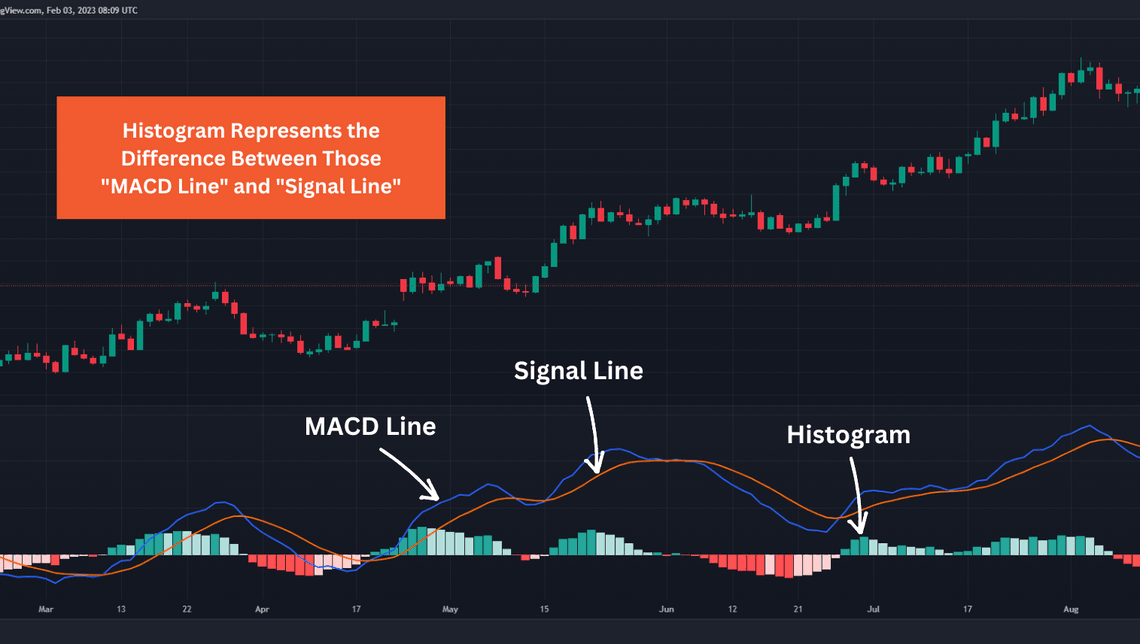
The MACD indicator is made by Gerald Appel and traders use it to find signals which will follow the trend. Usually, the MACD indicator is presented with 2 moving averages and a histogram. This histogram represents the difference between those 2 moving averages.
Our first moving average is called the “MACD line”. The line itself is calculated as follows 12-period exponential moving average and 26-period exponential moving average.
Our second moving average is the “Signal line”. Which is the exponential moving average of our MACD line. The default values of the indicator are 12 and 26 days moving averages which build our “MACD line” and 9 days moving average which is our “Signal line”.
It is important to mention that many traders confuse the two lines in the indicator with simple moving averages.
Remember, the lines are exponential moving averages and this will have a greater reaction to the most recent price movement. I am saying that because it is not the same as a simple moving average.
The MACD indicator has 3 stages that we have to look for:
As we know this indicator is trend following, so it works best when the market is trending. Traders will need to truly understand the MACD indicator as well as when to employ the indicator for optimal use.
Novice traders may find this indicator difficult to use initially. This is why going through basic moving average and exponential moving average fundamentals will benefit traders who are looking to make use of the MACD indicator.
What we have to know about the MACD indicator is that we should not use it as a signal indicator by itself. We should use it only for confirmation of our trade setup.
We should use this approach because the MACD indicator is lagging sometimes based on the price movement. This can cause our stop losses to be hit, and then the price can continue in our favor.
This is where most of the new traders are struggling by using this indicator and they see a lot of losing trades. If you know that most of the indicators are meant for confirmation of your analysis and not for a signal by itself you will be better than 90% of the traders.
Today I am going to present you with two strategies using the MACD indicator. The first one is straight forward and you can use it as a not lagging indicator. The second strategy is where we can use the signals from the indicator, but we are going to wait for a confirmation signal from the price action.
The first strategy is from Kory Hoang from Quantopian.com. The strategy is very simple but effective for GDXJ or the Gold Miners ETF (Jr. Gold Miners ETF). We are using the default values of MACD indicator 12/26/9 and we look for signals on 30 minutes charts. Our take profits would be 25% and our stop loss would be 5%.
Our second exit signal would be when the “MACD line” crosses in the opposite direction the “Signal line”. Since 2010 this strategy generated over 4000% return.
Let’s take a look at a few of the signals to get a better idea of how this strategy works.
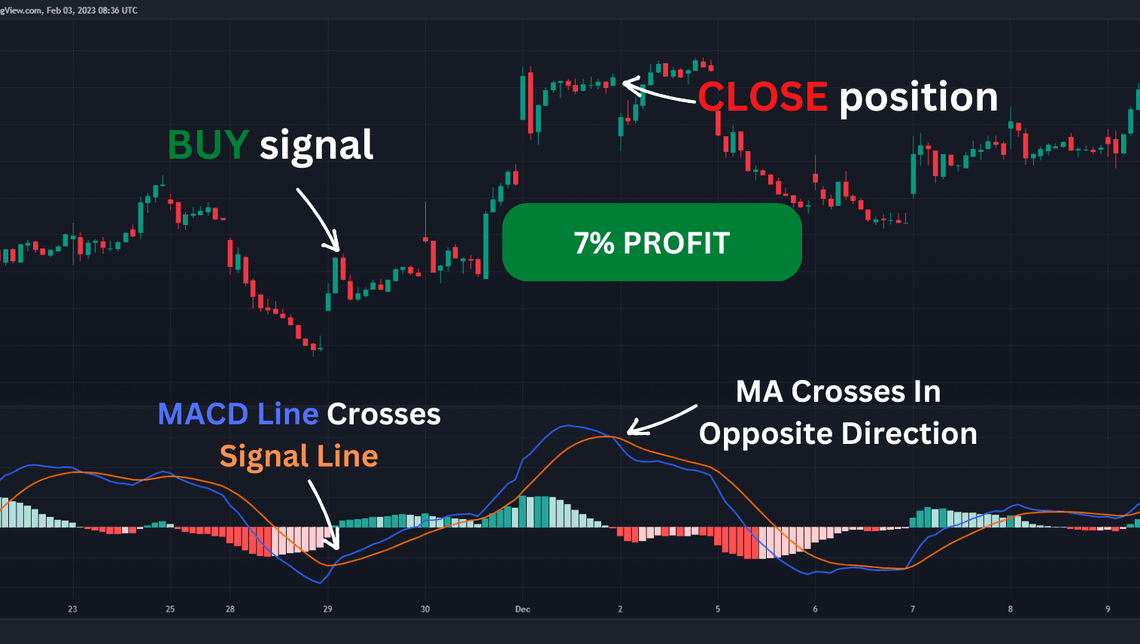
We are on 30 minutes chart of GDXJ and we can see that on the 29th of November 2022 we had a signal. Our “MACD line” and “Signal line” cross each other from bottom to top, which triggers our system for a buy signal.
We are going to look for an exit signal when MACD lines cross again in the opposite direction or to reach a 25% profit. In this case, we are going to close our trade for 7% win, since MACD lines cross in the opposite direction. This is why this system made such good returns over the years.
The second strategy that I want to show is a little bit more advanced since we are not going to execute the original buy/sell signals of the MACD indicator. Instead we are going to use it as confirmation of the price action.
So let’s see what is the setup for a long position.
We have to wait for a double bottom to be shown on our MACD indicator and we have to look for the bar where the histogram reached its highest point between our double bottom. This bar is going to be our pivot point. After we are done with that, we have to put the order above the maximum of our pivot bar.
Our stop loss should be under the same pivot bar. Our exit strategy is to wait for our stop to be hit, MACD indicator moving averages to cross the opposite way, or when “MACD line” crosses under the zero line.
Here is an example of a long position.
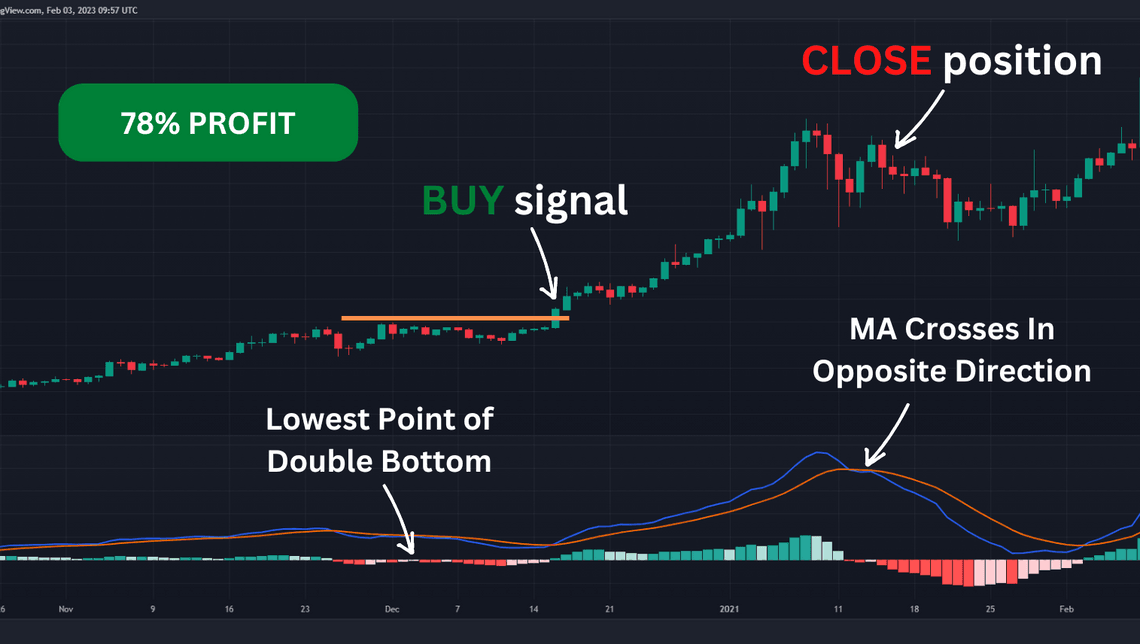
Our Daily chart is on BTC/USD. We can see here our system triggers a buy signal and what we should do is put an order entry above our pivot bar and wait for the price to open the position. Our stop loss would be under our pivot point. Our exit point would be when “MACD line” and “Signal line” cross each other in the opposite direction.
For a short position we have to look for the same rules, but we have to have our setup to be above the zero line. Let’s take a look at a signal for a short position as well
In our next example, we are going to show a sell signal again on our Daily chart of EURUSD.
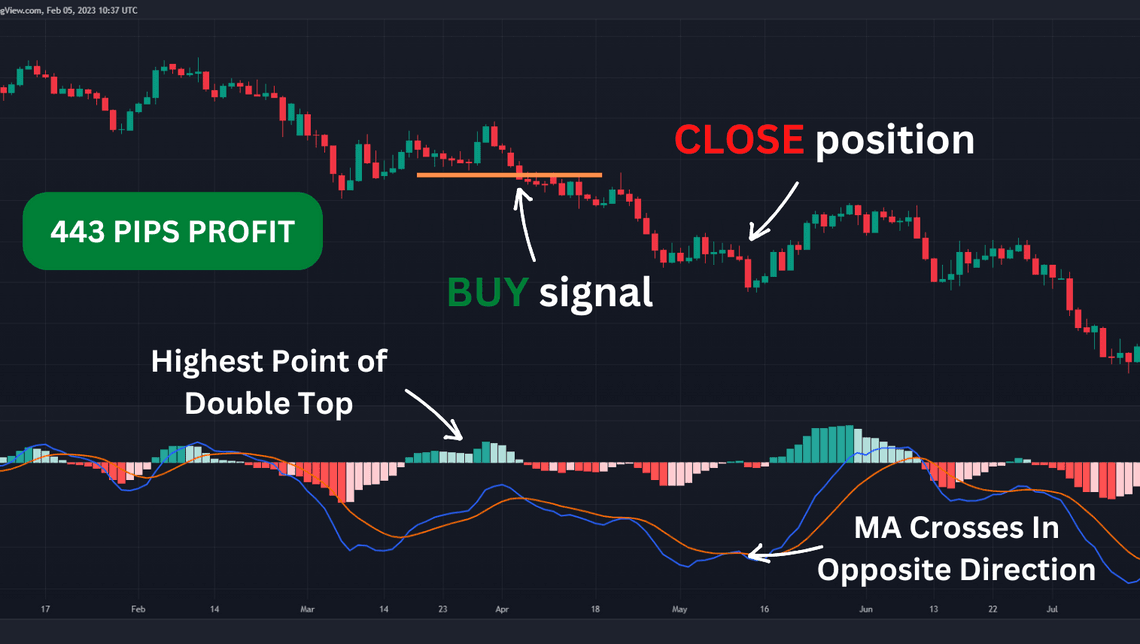
You can see that we targeted a double bottom here and we identified our pivot signal bar. Now what we have to do is to put our sell order a few pips under our pivot bar and our sell signal will be a few pips above the same bar. We are going to close our signal when MACD moving averages cross on the opposite side.
Something important that you should know about this system is that you have to put your entry orders and stop losses not too close to the pivot bar. This is because you can be stopped quickly by the volatility of the market.
The variations that can be implemented with the MACD indicator are almost infinite which makes it very personal to the trader. This subjective nature of the MACD will mean that results differ from trader to trader which takes away any consistency.
Quick Links
Legal Stuff
Social Media


