


Larry Williams Trading Strategies That You Have to Know


March 05, 2023
6 min
I’ve already talked a few times about a trader who made over 10 000% return in a couple of years and I have recommended his books in almost every post that I have made so far.
Now is the time to get more details about who this guy is and how he made such a legendary return for this short period of time.
I am talking about one and only day trader Larry Williams and his success in a field where most traders fail.
In this post, we are going to explore his vision of the markets and how he approaches them to make one of the best returns on investment strategies.
Larry Williams was born on October 6, 1942, in Miles City, Montana, in an ordinary American family. He began following the markets in 1962 and in 1987 participated in the world’s most prestigious trading competition, the Robbins World Cup.
In the same year, Larry Williams achieved an 11,000% return, turning $10,000 into a little over $1,000,000. He repeated this achievement in 1998, turning $50,000 into almost $1,000,000.
He contributed significantly to the development of day trading and created a few technical indicators, including the popular Williams %R.
Although he has written many books, the one I want to share with you is ”Long-Term Secrets to Short-Term Trading”. This book is one of my favorites and a great starting point for new traders. In this book, he shares his experience of finding profitable patterns in the markets and optimizing them for optimal return on investment.
For me, one of the key concepts is the so-called TDW, or Trading Day of the Week. This can also be applied to the day of the month and month of the year. This pattern represents the seasonality of the markets and identifies which days or months are more profitable than others.
If you are looking to buy long positions for S&P500 then you have to know that your best odds are in November and December. I previously shared my experience with seasonality and the tools I use to identify patterns, so you can read it here.
The image above is from the website Seasonax and you can see the provided statistics. If you want long positions for S&P500, then November and December are your best choice.
You have an almost 70% win rate if you bought this instrument for both months. I am sure that there are even more beneficial periods, but I am going to leave that research to you. Seasonax has some free instruments that you can play with, so I encourage you to check this website and see how it works.
I will dedicate a separate post to this topic since it is crucial for every trader. In the meantime, I will share some insights from Larry Williams’ book.
In this chapter, Williams discusses the various money management approaches he has tried in the past and shares his opinion on the best approach. He believes that the most effective way to manage your money is to risk a fixed percentage of your trading account. The formula that he uses is as follows:
(account balance x risk percent) / largest loss = contracts or shares to trade
In other words, you buy more contracts when you’re on a winning streak and fewer when you’re on a losing streak. The variable “largest loss” is included because you need to assume that you’ll experience at least the same loss at some point, if not a worse one.
Larry Williams recommends not risking more than 2% of your account on any single trade. He gives an example from a 2007 strategy where his $100,000 account grew to $1.2 million in 3 years by only risking 2% per trade - an incredible 400% per year.
There is a quote from the book that I really like which is as follows
If you are Tommy Timid, use 5 percent of your bank; should you think you are Normal Norma, use 10 percent to 12 percent; if you are Leveraged Larry, use from 15 percent to 18 percent; and if you are Swashbuckling Sam or Dangerous Danielle, use in excess of 20 percent of your account… and go to church regularly
That being said, I think is time now to present you with some of Larry Williams’s strategies that made him a small fortune through the decades.
The first strategy that I want to present to you from the book is the one and only “OOPS” strategy. Originally it is tested on the Bonds market and in S&P500 with almost 90% winning trades and estimated made Larry Williams over $1 million.
To use this strategy, follow these three steps:
That’s it! Nothing fancy, nothing complex.
A quick note: since this strategy was shared with many people over the years, it no longer works as well for Bonds and S&P500. The lack of pit sessions and the electronic changes in the field have made this strategy unprofitable.
You can still make it work with different financial instruments or with filters such as “Trading Day of the Week” or some seasonal anomalies. Have in mind that proper testing is necessary to avoid creating a curve-fitted strategy that will fail in real trading.
Here is an example of this strategy in S&P500:

Here is another system you can use in your trading: the “siren song of greed” setup, as named by Larry Williams. This setup often makes traders emotional and leads them to make irrational trading decisions.
However, this is actually good news for us because it means that the Efficient Market Hypothesis (EMH) is not entirely true and we can take advantage of this. This is what Larry has been trying to achieve throughout his career.
So what is this setup all about?
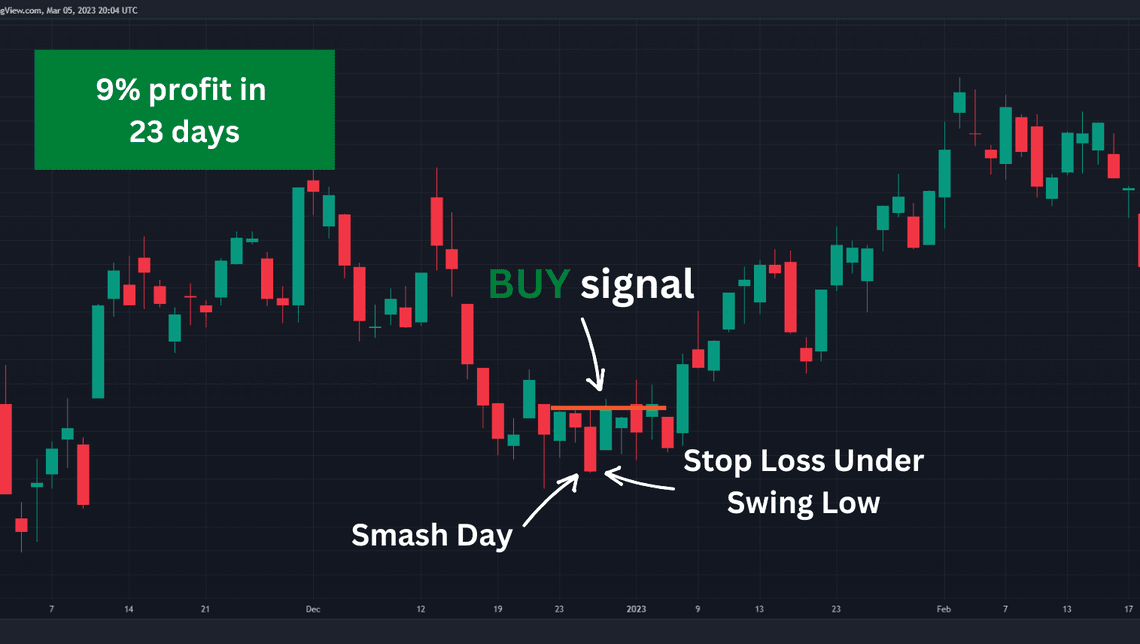
A normal smash day buy setup occurs when a day closes lower than the previous day’s low. During this type of setup, the price may also take out the previous three to eight days’ lows. For most traders, this looks like a bearish breakout, and sometimes they may be right. However, Larry suggests a new approach to trading this setup.
While this can be a valid bearish breakout, if the price moves in the opposite direction the very next day and trades above the high of the previous day, then you have a buy setup.
The fundamentals of this pattern entail an immediate reversal on the very next day, which puts those on the other side of the market movement in a difficult position. As a result, they may believe that the breakout has failed.
Experienced traders will typically exit and wait for another signal, while most traders will simply close their current position and open a new one in the opposite direction. At this point, their ego takes over and they believe they cannot be wrong. This is why it’s important to master the psychology of trading as well.
You can see an example of this strategy in S&P500:
This is the last strategy presented in the book ”Long-Term Secrets to Short-Term Trading”, but there are more examples in it. Therefore, I highly suggest purchasing and carefully reading the book.
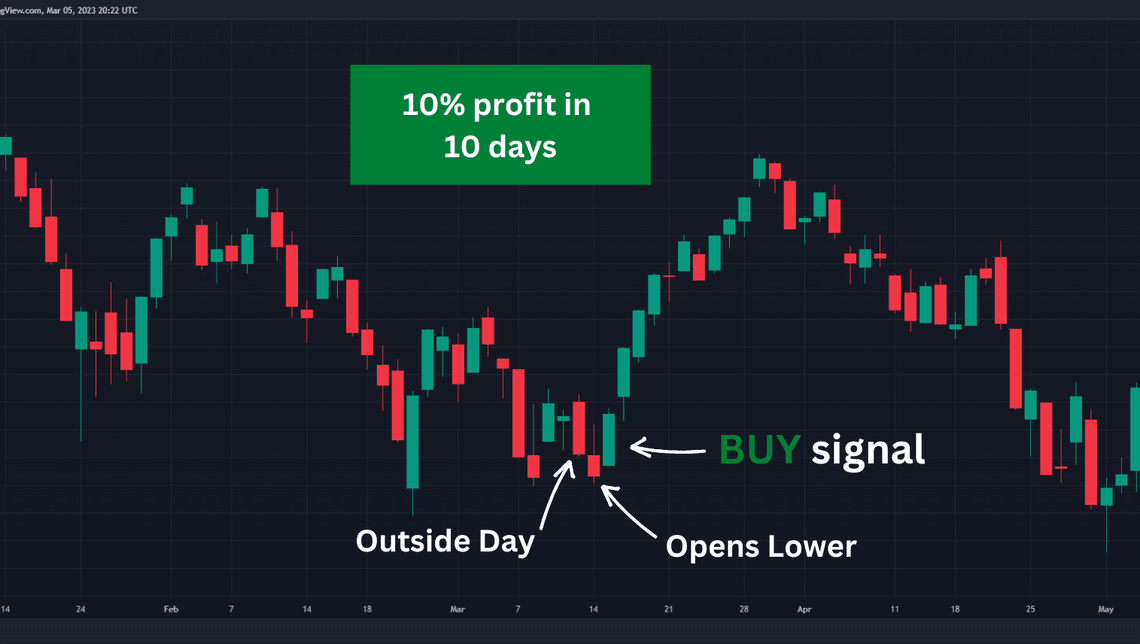
The setup for this strategy is as follows: For a buy signal, look for the day’s high to be greater than the previous day’s high, and the low to be lower than the previous day’s low (or in other words outside bar).
The close should be below the previous day’s low and tomorrow opens lower than the outside day’s down close, then we buy on the next day’s opening. Larry does not provide an exact exit rule for this strategy, but based on the book probably it is the first profitable day close.
I know it sounds difficult but will show you an example in a little bit.
Larry conducted a backtest for the S&P500 with the TDW filter. Buy on any day but Thursday and the results were incredible. The test was performed between 1982 and 1998, and this strategy had 86% winning trades, 39 consecutive wins, and a profit factor of 3.02.
This pattern is pretty rare, so be ready for a buy signal the next time you see it.
In the image below you can see an example in S&P500
With this post, I wanted to share with you different ideas and strategies that I learned from Larry Williams’s book ”Long-Term Secrets to Short-Term Trading” and how you can use different variations of them.
It is important to note that many market advantages may not work in the future, so you must be able to measure and calculate when it is time to adjust or stop using a strategy altogether.
Quick Links
Legal Stuff
Social Media


