


Bollinger Bands Trading Strategy - Learn to Beat the Markets


January 22, 2023
4 min
Bollinger Bands is one of the most famous trading indicators, used by one of the most famous traders in the world.
John Bollinger developed this indicator to help us measure a market’s volatility. But not only that. It will also help us to identify “overbought” or “oversold” conditions.
Bollinger Bands consist of a middle-moving average with two outer averages. The moving average in the middle is with 20 periods value.
This indicator uses a simple moving average because the standard deviation formula also uses a simple moving average. When you look back to that period the standard deviation is the same as for the simple moving average. The outer moving averages are usually set with a value of 2 standard deviations above and below the middle band.
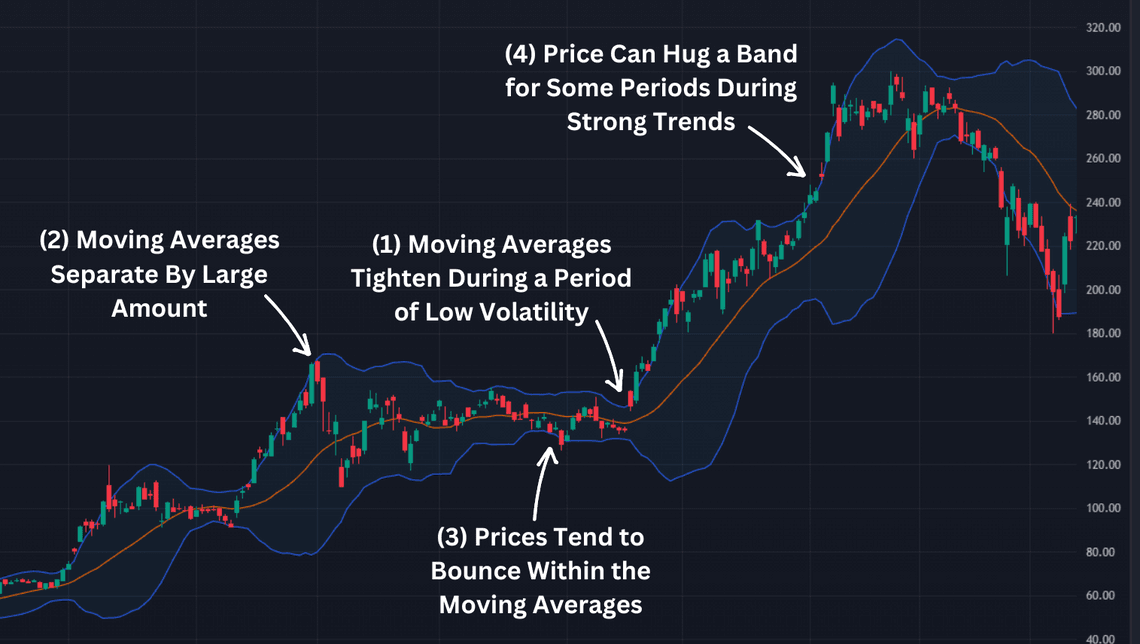
You have to look for a few stages of Bollinger Bands indicator so that you can use it fool potential:
So far you have been learning about the foundation of Bollinger Bands.
Now is the time to share with you a strategy known from the book “Trading Systems” by Urban Jaekle and Emilio Tomasini.
In this book, they share a simple, but very effective strategy: Buy when the price closes above the top Bollinger Bands level and Close when the price crosses the middle line of the indicator.
This is a perfect example of a momentum strategy, in which the price will come to normal levels when we are going to sell.
When the price of our instrument crosses the top bar of our indicator, that gives a signal that we have a huge amount of buyers at this time. And our standard deviation is above our normal levels.
Sell when our price crosses our middle moving average means that our standard deviation is back to our normal levels. Then we are going to wait for the momentum signal to give us an alert again.
The default values of Bollinger Bands are set to the length of 60 and distance of 2 standard deviation points. By changing these parameters you can adjust the trade frequency.
The smaller you set the length for the moving average and the smaller you choose the distance of the Bollinger Bands, the faster will react to market changes, and the more signals you will get. This gives you the possibility to adjust the system strategy to your personal needs.
Bollinger Bands have further advantages for building mechanical trading systems. Due to their volatility-based component, they can adapt to different market conditions. Additionally, they provide a natural exit point by using the moving average between the Bollinger Bands.
Now let’s take a look at a few signals, one in Stocks and one in Forex Markets.
Let’s start with the Stock Market.
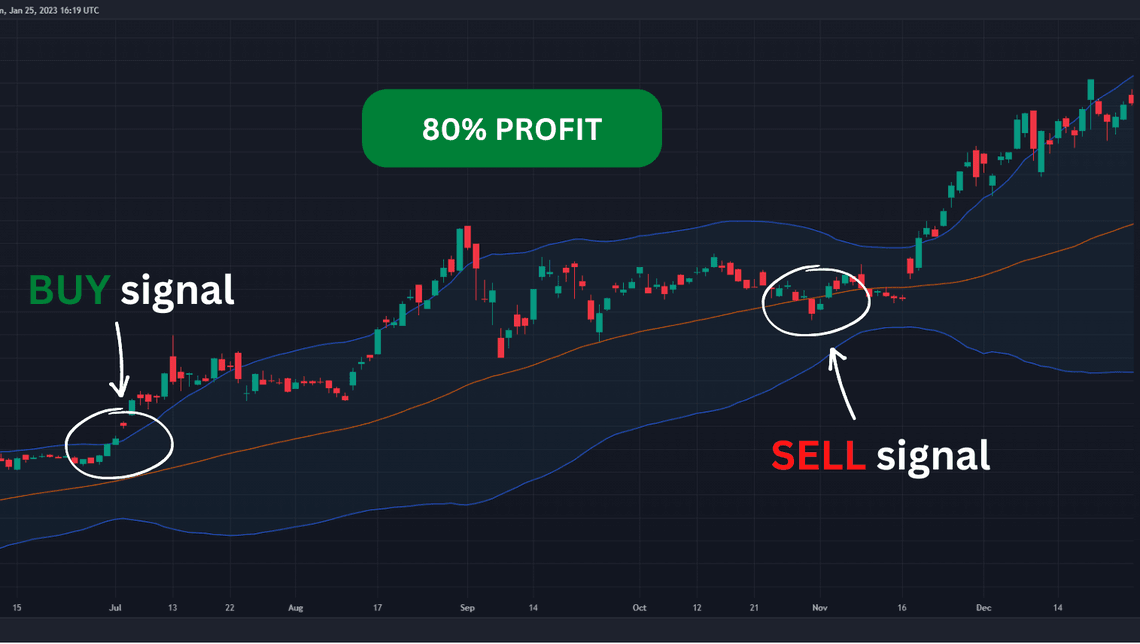
We are on a Daily chart of Tesla and we can see that our system gives us a buy signal on the 30th of June 2021. On this day the price of Tesla’s stocks is reaching over the top moving average of our Bollinger Band indicator.
This means that the stock is in a momentum state and there are more buyers than sellers. Our exit signal is on the 30th of October. Where the price is reaching our middle moving average, which means that the price at that point is at its normal average state.
For these four months, we have generated an 80% return on our investment with both following the trend and following the momentum of the stock.
Our Second market, in which I want to show you a signal is the Forex Market.
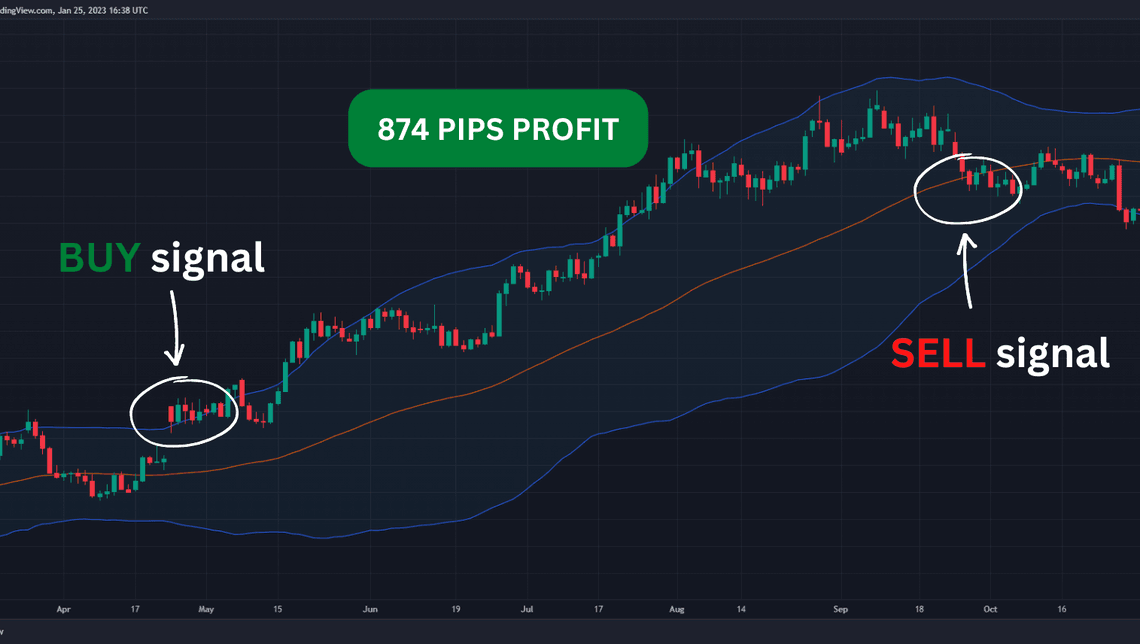
We are on the Daily chart for EUR/USD pair and you can see that on the 24th of April 2017 we have a buy signal. This is because the price crosses our top moving average of Bollinger Band. Our sell signal is a few months later on the 27th of September when we can collect a sweet profit of 874 pips.
By using this strategy, we are following the big institutions moving the price in our favor. Or in other words, we are using the momentum of a specific instrument and we are trying to collect as much as possible from this move.
Let me give you a bonus example here, but this time in the Cryptocurrency Market.
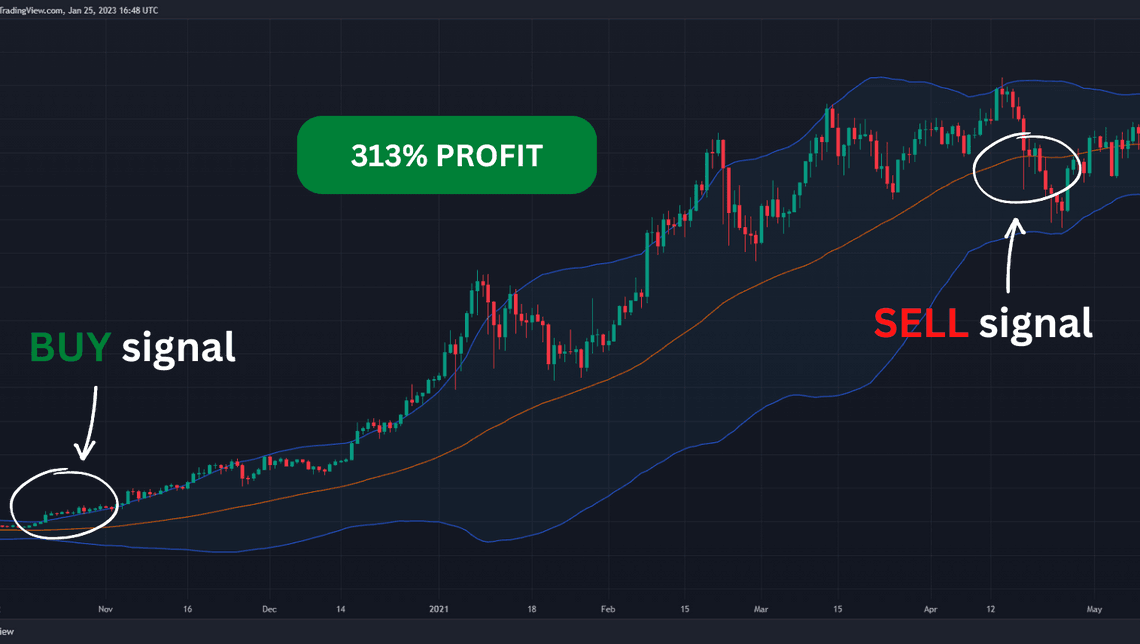
We are looking at the Daily chart of Bitcoin. Since this market is still not efficient enough a lot of the systems are working great and you can expect huge gains. You can see that on the 10th of October 2020, we have a buy signal and our sell signal is on the 21th of April 2021 for a profit of 313%.
By showing you signals in different markets and timeframes I want to show you that this system is not created only for a specific stock or currency pair. It’s created to follow the market conditions and to adapt based on the market moves.
Even the creators of this strategy made their backtests in 7 different markets to create the ultimate portfolio. Their backtest is from 1994 to 2005 and for this period this system has a net profit of over 220 000 dollars. Profitable trades of 42%, profit factor of 1.96, and 261 trades.
You can see that this strategy is successful in different timeframes and different markets. Yet the authors of that strategy are saying that you can still optimize it and they have some topics in their book on how to do that yourself.
Quick Links
Legal Stuff
Social Media


