


ADX Indicator Strategy (Everything you need to know for ADX)


January 22, 2023
5 min
The full name of the ADX indicator is Average Directional Movement and it’s mainly used to measure the strength of the trend.
You can often see the ADX indicator integrated into the so-called DMI indicator. This combines the ADX (represented with bold line) and two moving averages called +DI (positive directional indicator) and -DI (negative directional indicator).
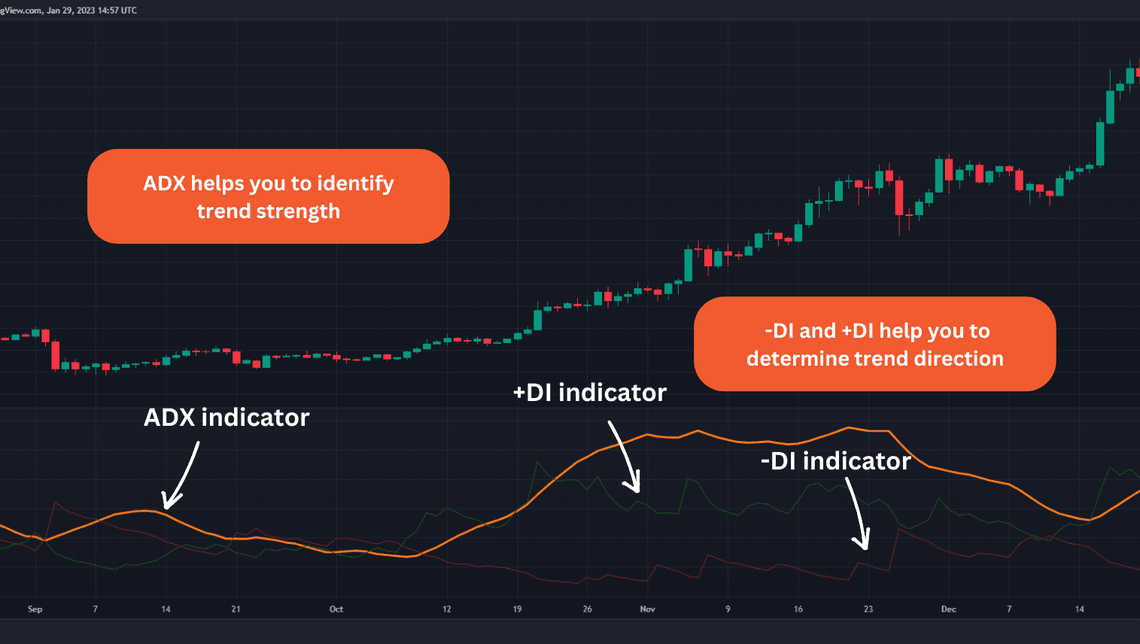
The ADX helps you to identify trend strength, on the other hand -DI and +DI help you to determine trend direction. ADX is created by Welles Wilder to help him analyze the commodity market on daily basis. Of course in our days, the ADX indicator is broadly used in different time frames and different markets.
You have to look for a few stages of this indicator:
As I said at the begging of this post I will give you two strategies. They can help you analyze the markets and help you to make better decisions in your trading. Both strategies are from the book “Street Smarts” by Laurence Connors and Linda Raschke.
Linda Raschke is a famous commodities and futures trader. She is presented in one of Jack Schwager’s books called “The New Market Wizards”.
Laurence Connors is a famous quant trader, known for the book “Short Term Trading Strategies That Work”. Together they create the “Stree Smarts”, one of the iconic books for day traders and swing trades.
In the book this chapter is called “Holy Grail”. When you start reading it you will see that the authors say that probably they made this title a little bit like clickbait, but this is the closest you can get for “Holy Grail” strategy.
This is a simple mean-reverting strategy and if you read a little more books of Laurence Connors you will see that those types of strategies are one of his favorites. The rules that you have to apply if you want to use this strategy in your trading are as follows:
A 14-period ADX must initially be greater than 30 and rising. This will identify a strongly trending market. Look for a retracement at price to the 20-period exponential moving average.
Usually, the price retracement will be accompanied by a turndown in the ADX. When the price touches the 20-period exponential moving average, put a buy stop above the high of the previous bar.
Once filled, enter a protective sell stop at the newly formed swing low. Trail the stop as profits start rising and look to exit at the most recent swing high.
If you think the market may continue its move, you might exit part of the position at the most recent swing high and tighten stop on the balance. If stopped out, re-enter this trade by placing a new buy stop at the original entry price.
After a successful trade, the ADX must once again turn up above 30 before another retracement to the moving average can be traded.
Know that for sell signals the rules are the same, but reversed. Let’s take a look at a couple of signals now.
We are on the Daily Chart of BTC/USD dollar and you can see that on the 26th of January 2020 we have a buy signal, since all of our criteria are met.
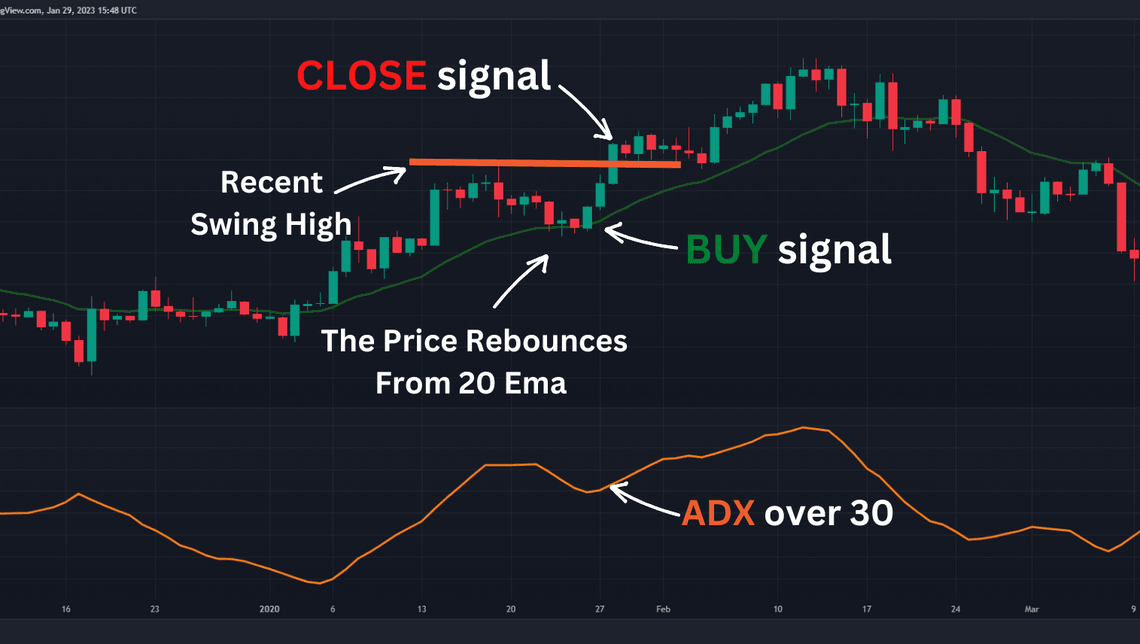
Our ADX indicator is above 30 and the price is testing the 20-day exponential moving average. We have a few candles that are testing that 20-day moving average, but none of these candles actually managed to break out the previous bar.
On the 26th we can see that the bar on this day manages to break out the previous bar and the 20-day moving average, which is our buy signal.
Our stop loss would be under the previous candle and our take profit would be your recent swing high, which in our case would be on the 19th of January for a profit of almost 7%.
Now let’s take a look at one sell signal for this strategy.
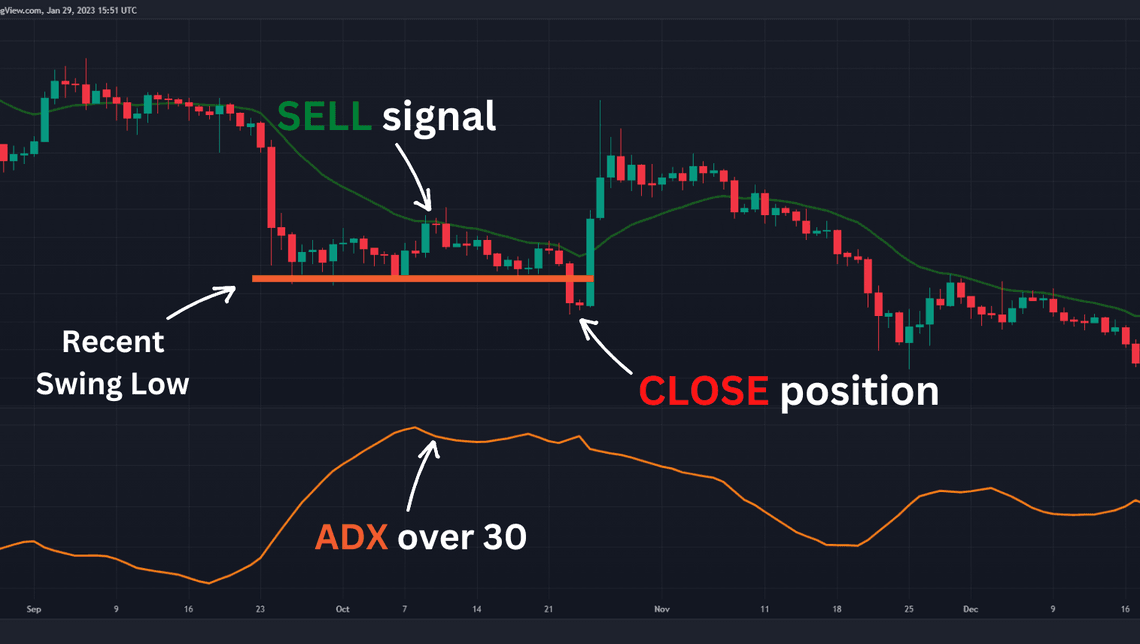
We are again on the Daily chart of BTC/USD and we have a sell signal on the 11th of October 2019. ADX is above 30, the price is testing a 20-day moving average from the bottom side and on this day the price breaks the previous candle test.
Our take profit is on the previous swing low, which in our case is on the 6th of October for a sweet profit of 6%.
The second strategy is with the combined indicator DMI, where you have ADX indicator, -DI, and +DI. In the book it’s called “ADX Gapper” and you will find out why shortly.
Now, let’s take a look at what you need as a setup from the DMI indicator.
You will use a 12-period ADX and a 28-period +DI/-DI. The ADX must be greater than 30. For buys, the +DI must be greater than the -DI, for sells, the -DI must be greater than the +DI
Now that you know what you need from the indicator, here is what you need to form a buy signal.
Today’s open must be a gap below yesterday’s low. A buy stop is placed in the area of yesterday’s low. If filled, a protective sell stop is placed at today’s low. Lock in profits with a trailing stop and either exit the position before the close or carry it into the following day if it closes strongly.
Like the previous system, the sell signals are with the same rules but reversed. It’s time to look at a few signals for this strategy.
We are on a Daily Chart of Tesla stock and you can see that on the 16th of July 2013 there was a BUY signal. All of our criteria are met and you had a possibility to open trade around $21.75 per share. We have ADX above 30, +DI is above -DI which indicates an uptrend.
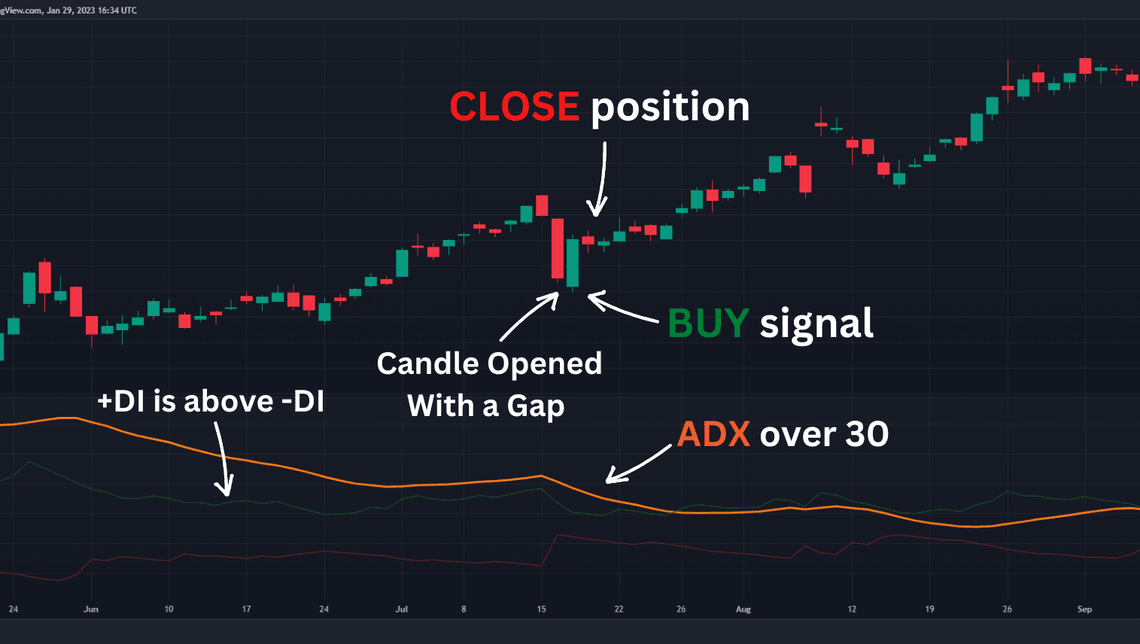
On the 16th of July the candle opened with a gap under the previous close, and the current candle filled that gap giving you a chance to buy Tesla shares. Your exit options are either waiting till the close of the current gapped candle or to wait for one more day if the current candle closes strongly.
Let me show you a sell signal for this system.
We are on Dow Jones Daily Chart and you can see that there is a sell signal on the 20th of March 2020. Everything needed for a valid sell signal is there. Again you have ADX above 30, which indicates a strong trend.
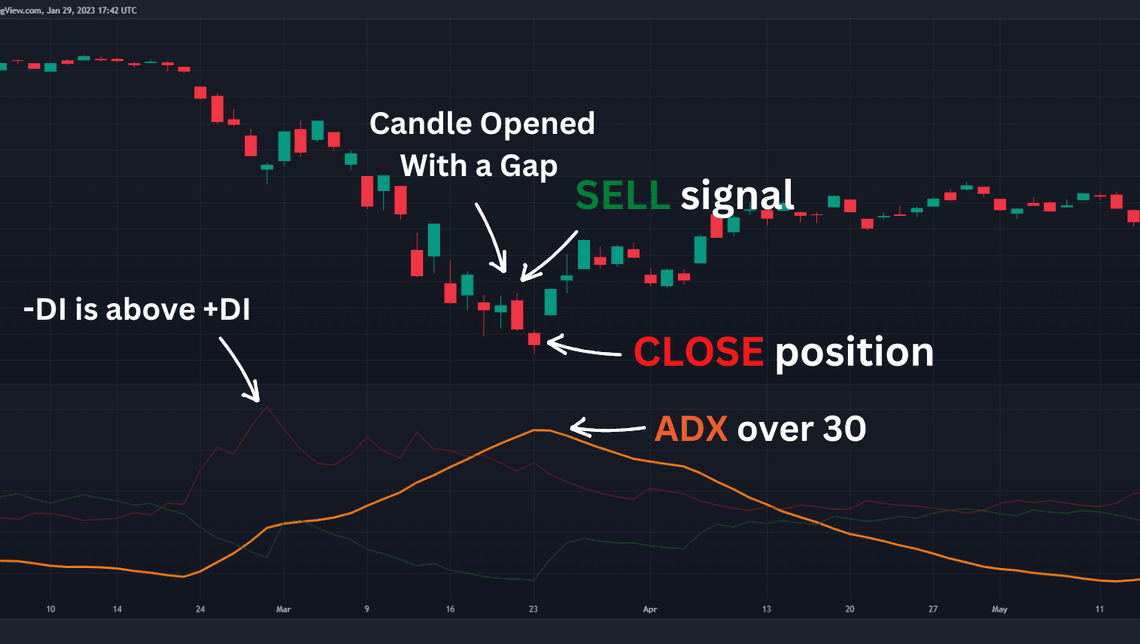
You have -DI above +DI, which indicates a downtrend and you have candle gapped above the previous day close. Your exit should be either till the close of the current day or to wait for one more day if the current candle closes strongly.
By studying these two strategies you will learn when a specific market is forming a strong trend and how to properly follow it. These strategies are effective in different timeframes and different markets. You have to be cautious of low volatile instruments and ranging markets.
The “Street Smarts” is one of my favorite books and it’s great for new traders. Inside you can find a lot of different strategies with different indicators, that can help you in your trading.
Quick Links
Legal Stuff
Social Media


